In England the NHS carried on treating long waiters in April as if the ‘managed breach’ had never come to an end, scoring a significant improvement in waiting times
Waiting times in England improved markedly during April because the NHS continued to treat large numbers of long waiting patients, even though the “managed breach” was supposed to have expired.
April and May were the months when the perverse “adjusted admitted” and “non-admitted” targets were not only restored, but made mandatory, in a last hurrah before their eventual and unmourned abolition in June. So in April hospitals were, once more, expected to devote at least 90 per cent of their admitted capacity to treating short waiting patients.
‘Hospitals carried on doing the right thing by treating long waiters instead of their short waiting patients’
Happily they appear to have largely ignored these strictures, and instead carried on doing the right thing by treating their long waiters instead of keeping them waiting.
The improvement in waiting times is even more impressive when you consider that we tend to see growth in the spring – the waiting list usually gets longer from around February to July.
If you include trusts that are not reporting their data, the English waiting list “may have been just under 3.3 million patients”, according to the official Statistical Press Notice – which is around the point where I reckoned, last year, that 18 weeks becomes difficult to sustain.
In the following analysis, all figures come from NHS England. If you have a national statistic you’d like to check, take a look at the Gooroo NHS waiting times fact checker.
- 18 week waits, April 2015: explore the maps
- Dear health secretary: Here’s what you should do about waiting times
- More analysis from Rob Findlay
England-wide picture
The NHS continued to admit long waiting patients as if the managed breach was still in full swing, ignoring the mandatory sanctions that had temporarily swung into action to punish such good deeds.
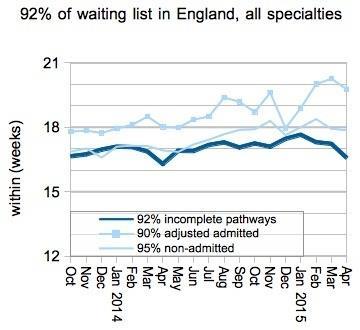
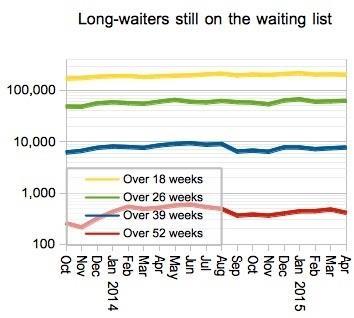
The improvement in real waiting times since Christmas (shown by the dark line in the chart) is actually quite impressive.
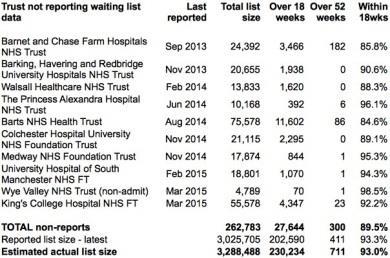
Unfortunately, more trusts have stopped reporting their waiting list data.
Wye Valley Trust omitted the non-admitted element of its waiting list data, and King’s College Hospital Foundation Trust was unable to report any referral to treatment data at all. If you add back in the last known positions at each non-reporting trust, the estimated waiting list was around 3.29 million patients, as you can see in the chart below.
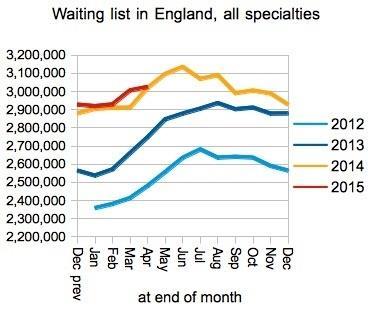
The non-reporting trusts are not included in the next chart, so don’t be fooled into thinking the waiting list has not grown since last year.
If you’d like a time series that includes all the non-reported estimates (and a wealth of other analyses), George Donald has put together an excellent collection of RTT data using Tableau Public.
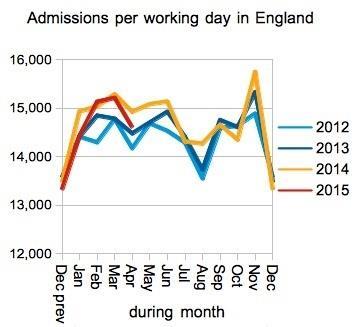
Admissions per working day were lower than in April last year.
Reported rates of long waiters are roughly flat, although with so many trusts having not reported data for so long it is increasingly hard to have much confidence in these figures.
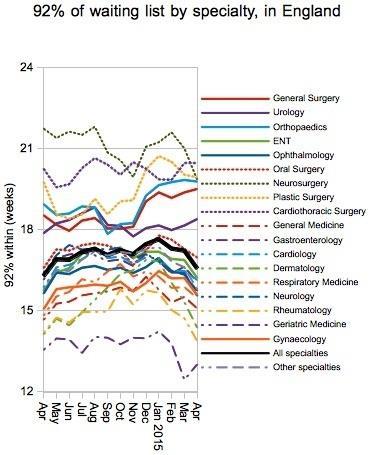
The biggest improvements were seen in specialties where waiting times were already fairly short, with the exception of neurosurgery, where there has been a large and welcome shortening of waiting times.
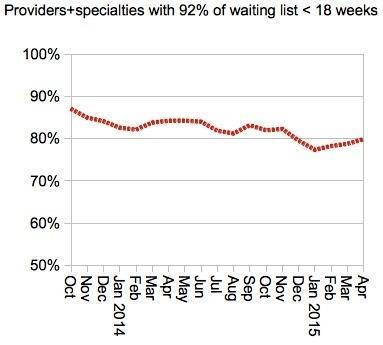
The proportion of specialties within trusts that were achieving the main target of 18 weeks improved only slightly.
Improvements in waiting times were mainly seen in trust specialties that already had fairly short waits. This is in line with the specialty level observation shown above.
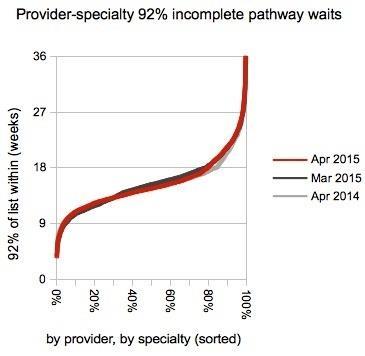
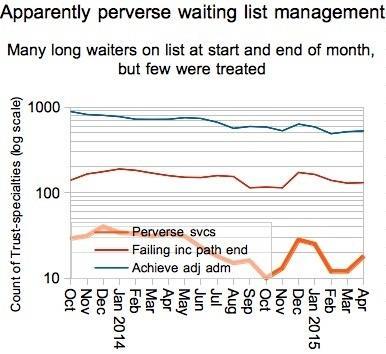
Perversely, the number of services that were apparently managing rose slightly. These are services that achieved the adjusted admitted and non-admitted targets, now abolished, even though they breached the incomplete pathways target at the start and end of the month.
Again, this is consistent with the NHS continuing as if the managed breach had never ended.
Local detail
Wye Valley has risen to the top of the top 20 this month, but this will partly be an artefact of its non-reporting of non-admitted incomplete pathways data – or, to avoid the triple negative, the fact that it only reported data relating to the inpatient and day cases on its waiting list.
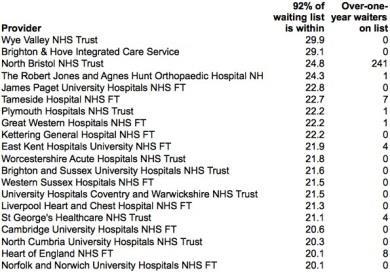
Congratulations to Circle Bath Hospital for reducing its waiting times from 21.5 weeks to 15.4 weeks, and for dropping out of the table decisively.
Data for May, the last full month before the perverse adjusted admitted and non-admitted targets were dropped, is due to be published by NHS England on 9 July.
Rob Findlay is founder of Gooroo Ltd and a specialist in waiting time dynamics


No comments yet