


- MP presses government stats chief on use of data
- Follows HSJ revelation
- Analysis shows many more people are dying in care homes and at home, but not attributed to covid-19
- Update: Government changes its reporting
A Parliamentary committee has challenged the government over its daily presentation of covid-19 deaths, after HSJ revealed the public had been misled.
Commons public administration and constitutional affairs committee chair William Wragg raised concerns about “international comparisons” given at the daily presentation, and about the availability of figures on deaths in care homes.
It follows HSJ revealing the figures wrongly indicated the UK was on a lower mortality curve than France; whereas this is only because the French figures include deaths in care and nursing homes. Officials had told viewers all the numbers were hospital-only deaths.
Conservative MP Mr Wragg, in a letter to the government’s national statistician, also raised the fact that the “headline given to the public each day… does not include some of the oldest and most vulnerable in society”. He cited charity leaders saying the government is “airbrushing older people out”.
Daily death reports from the Department of Health and Social Care and NHS England until now reported only hospitalised covid-19 deaths. Mortality figures from the Office of National Statistics include deaths outside hospital, but they are published on a weekly basis, with a delay of about 10 days.
Mr Wragg said: “At this time, many international comparisons are being made when considering the spread of and response to the pandemic in the UK. As the principal advisor to the government on statistics, do you believe these comparisons should be made based on the DHSC statistics or the ONS statistics?”
The government has responded to the concerns today (Thursday 16 April) by showing on its daily chart two lines for the UK: One, more up to date, using hospital-only deaths, and one using deaths in all-settings, which lags by more than a week, but shows UK numbers above those in France and Italy.
New analysis by HSJ of the ONS figures suggests these are also probably substantially underestimating deaths in care homes due to covid-19.
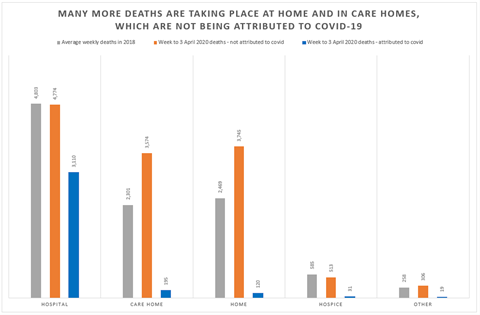
A 2018 average is used as a comparison, because this is the most recent period figures are available. Because of population shifts and other factors, the number of weekly deaths normally change and fluctuate slightly.
It shows that, in hospitals, if covid-19 attributed deaths are discounted, then fewer fatalities took place in the week ending 3 April (the most recent to be reported) than did in an average week in 2018 (the most recent where figures are available). However, in care homes and in people’s own homes, many more deaths took place which have not been linked in death certificates to covid-19.
These may be a mixture of deaths which are actually caused by coronavirus but have not been attributed to it — with the vast majority of testing only taking place for hospital patients — and additional deaths taking place for other reasons, potentially as “collateral damage” of the response to covid-19 by government, individuals and the health service.
Care providers have made major criticisms about the lack of testing and other support available for that sector, and there has been concern older or disabled people are not being taken to hospital when they have covid-19 or other health needs. Care England, which represents care providers, yesterday estimated there had been about 1,400 deaths in homes.
The government yesterday published a plan for helping the adult social care sector and said it should receive funding.
In response to the concerns about deaths statistics, government has said it is working on how to get quicker reporting of deaths in the care sector, while Public Health England medical director Yvonne Doyle said: “There are so many measures of death… that it can be very difficult to understand what exactly you’re looking at.”
Updated on 16 April at 6pm to state that as of today’s press conference, the government updated the international comparison chart with two lines, to show both UK hospitalised and all-settings deaths.
Source
Letter, analysis of ONS figures
Source Date
April 2020


3 Readers' comments