The English NHS treated record numbers of long waiting patients in March, taking full advantage of the last month of the ‘managed breach’ and achieving the main 18 weeks target at the end of the financial year
NHS England took full advantage of the “managed breach” during its final month, admitting record numbers of long waiting patients to achieve the main “incomplete pathways” target at the end of March.
It didn’t just break the record, it smashed it.
Some 44,312 over-18 week waiters were admitted in March, beating by a whopping 10 per cent the previous record of 40,206 which was set way back in April 2008 when the NHS was going hell for leather to achieve 18 weeks for the first time.
‘The health secretary should simplify targets by abolishing perverse ones’
But at midnight on 31 March, the “managed breach” came to an abrupt end.
From that moment onwards, hospitals have been subject to mandatory sanctions and regulatory action if they treat “too many” long waiting patients. Once again, patients are set to be left stranded on waiting lists after they tip over the 18 week mark; short waiters will get preferential treatment; and waiting times in England are set to rise.
As I believe I may have mentioned before, it might be a sensible idea for the health secretary to simplify these targets by abolishing the perverse ones.
In the following analysis, all figures come from NHS England. If you have a national statistic that you’d like to check up on, you can download our Gooroo NHS waiting times fact checker.
England-wide picture
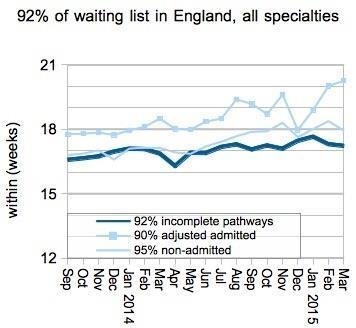
Performance on the main “incomplete pathways” target was pretty steady in March, boosted by the record numbers of long waiters being treated from the waiting list.
When the April figures come out, we can expect the “adjusted admitted” line to come crashing back to just below the 18 week mark, as mandatory sanctions restrict hospitals’ ability to select long waiting patients for treatment.
As a result, waiting times for those still waiting can be expected to rise, and a breach of the “incomplete pathways” target is expected in the coming months.
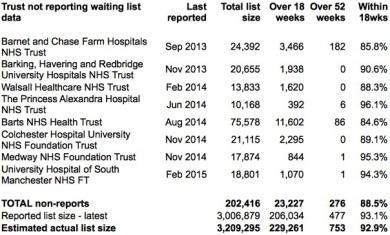
Lots of trusts are still not reporting their waiting times data.
It is good to see Heart of England Foundation Trust reporting again, but now we have lost University Hospital of South Manchester FT. The last reported positions at each trust, and the estimated effect on the national waiting list, are shown below.
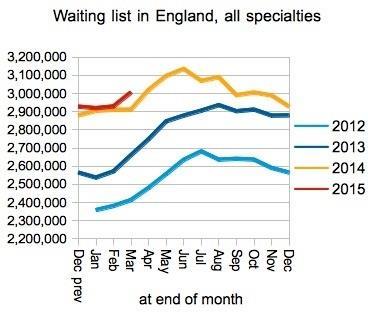
Our daily experience of queues tells us that a longer queue means longer waits, and for the last few years the English waiting list has been growing.
The growth in March is partly the usual seasonal growth that generally happens in spring, but it is larger than this time last year (and that remains true if you add back in the non-reporting trusts).
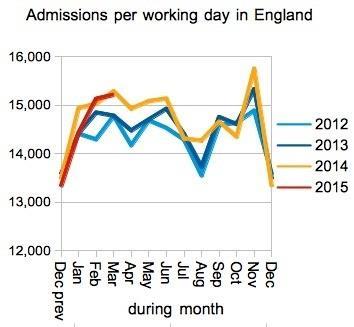
Admissions per working day were the same as last year, even though the number of long waiters being treated was much higher.
So the record numbers of long waiters being treated was the result of trusts (rightly) treating routine patients more on a first come first served basis than before, rather than the result of extra admissions being laid on.
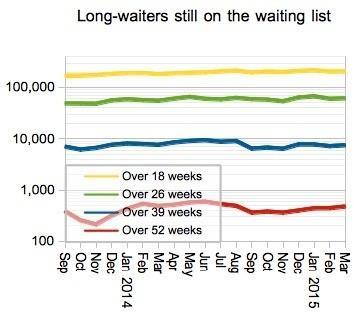
Long waits were roughly static. Of the 477 reported one year waits, some 232 were waiting for Orthopaedics at North Bristol Trust.
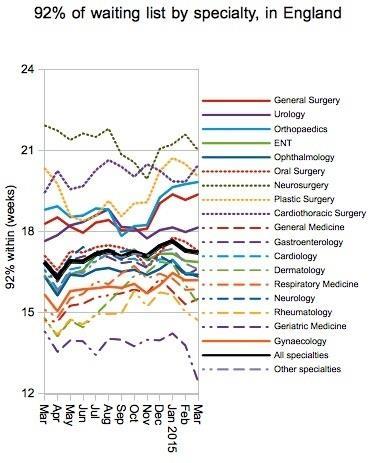
Orthopaedic waiting times continued to rise across England generally, and this remains the longest waiting of the large surgical specialties.
General surgery is hot on its heels. But most other specialties slightly improved their waiting times, particularly those that already have short waits.
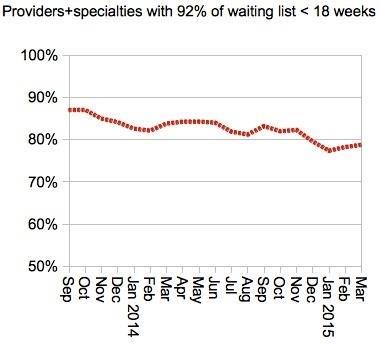
The proportion of specialties within trusts, who achieved the main “incomplete pathways” target, remained steady.
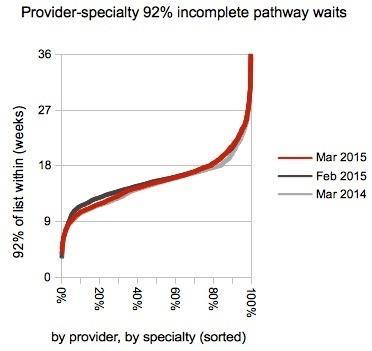
There were marked improvements in services that already have quite short waits, while waits at the long waiting end of the spectrum were largely unchanged.
This is in line with the observation above that short waiting specialties improved while longer waiting specialties deteriorated.
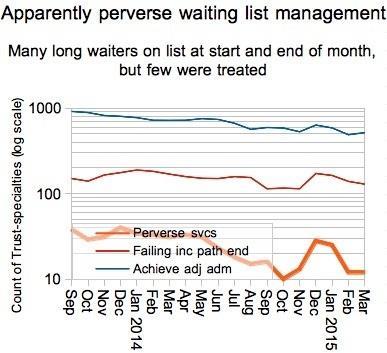
The number of trust specialties that are apparently managing perversely - achieving the admitted and non-admitted targets even though they have lots of long waiters to treat - remained very low, as you would expect in a month when there was an amnesty on those perverse targets.
Expect this to rise from April as the perverse targets come back with a vengeance.
Local detail
There was some jostling at the top of the “top 20” table in March, with the independent sector orthopaedic service in Brighton and Hove reaching the top slot.
‘Congratulations to Morecambe Bay for dropping out of the table’
The Robert Jones and Agnes Hunt Orthopaedic Hospital FT has improved its waiting times and made its way down to 4th place in the table.
Last month it came from nowhere to take the top slot in February’s data, reporting in their board papers that “a number of our month-end validation processes require further review and as such have been discontinued in the February position”.
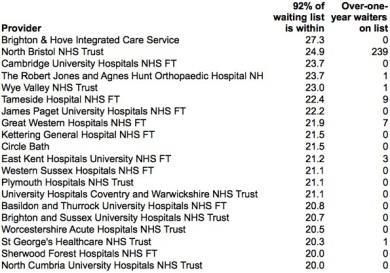
Congratulations to University Hospitals of Morecambe Bay FT for dropping out of the table, all the way from 14th to 77th place by improving 92nd centile waits from 20.4 weeks to 17.0 weeks and achieving the main waiting times target.
Data for April - the first month with mandatory perverse sanctions - is due out on 11 June.
Topics
- NORTH BRISTOL NHS TRUST
- Performance
- South West
- Targets
- THE ROBERT JONES AND AGNES HUNT ORTHOPAEDIC HOSPITAL NHS FOUNDATION TRUST
- UNIVERSITY HOSPITAL OF SOUTH MANCHESTER NHS FOUNDATION TRUST
- UNIVERSITY HOSPITALS BIRMINGHAM NHS FOUNDATION TRUST (formerly HEFT)
- UNIVERSITY HOSPITALS OF MORECAMBE BAY NHS TRUST
- West Midlands


1 Readers' comment