Preventing the NHS being “overwhelmed” was the justification given by the prime minister for both spring and autumn lockdowns, and again for tighter restrictions through the winter.
With government and MPs now making their decisions on next steps, we look at the most up to date data, some of it public and some obtained by HSJ, on how covid is affecting hospitals.
Covid pressures are still growing in many hospitals
Covid hospital admissions are falling at a national level and in five out of seven NHS regions - the exceptions are London and the South East. But they have not fallen very far - in five NHS regions, seven-day admissions are higher than when lockdown began on 5 November, and in the North East and Yorkshire they are about the same. In the North West they are down more than 10 per cent.
And there are many local areas where both admissions (also known as new covid cases in hospital) and covid occupancy (the share of hospital beds taken up by covid patients) are still growing.
This chart shows how 14 out of 42 health systems saw covid admissions grow in the week from 18 to 25 November, and 28 out of the 42 saw covid occupancy grow (you can download a searchable PDF of it at the bottom of this article).
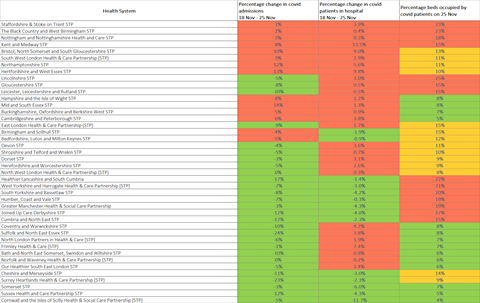
Looking at hospital trusts, 47 out of 124 general acute trusts (38 per cent) saw seven-day total covid admissions grow from 18 to 25 November. Fifty trusts (40 per cent) reported growth between 23 and 25 November (Monday and Wednesday). At 28 trusts (23 per cent) seven-day total covid admissions grew across both these periods.
This map shows all these trusts and whether admissions have risen (red triangle) or fallen (green triangle) since Monday’s figures. The size of the arrow indicates total admissions in the seven days to Wednesday morning:
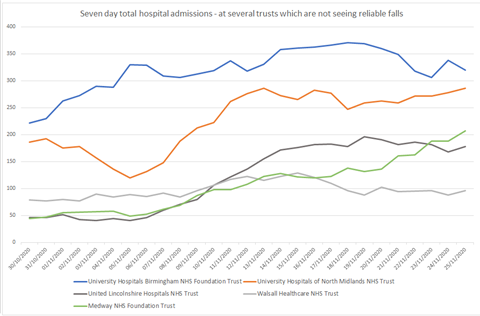
This chart (right) shows the trend at several selected trusts which are not seeing admissions reduce, three weeks after the national lockdown began. They include University Hospitals Birmingham, a very large trust which serves nearly the whole of that city.
How many covid patients are in hospitals
Looking at the percentage of beds taken by covid patients, at 84 general acute trusts (68 per cent), hospital covid occupancy grew from 23 to 25 November. At 59 trusts (48 per cent), it grew from 18 to 25 November.
The map below shows, for each of these trusts, whether admissions have risen (red triangle) or fallen (green triangle) since Monday’s figures.
It illustrates the reality that many of the areas where covid hospital pressures are falling still have high admissions and occupancy; while many of those where pressure is lower, are seeing it rise.
An NHS England spokesman told us: “While nationally the number of people needing hospital treatment for covid-19 has begun to level off some areas are still seeing numbers rise.”
How full are hospitals overall and are they being overwhelmed?
On paper, total occupancy - of covid and non-covid patients - is lower at the large majority of hospitals than it normally is during winter (see chart at end of piece). Overall occupancy at national level has not been rising quickly. Overall critical care occupancy has been rising but it is not high by normal seasonal standards.
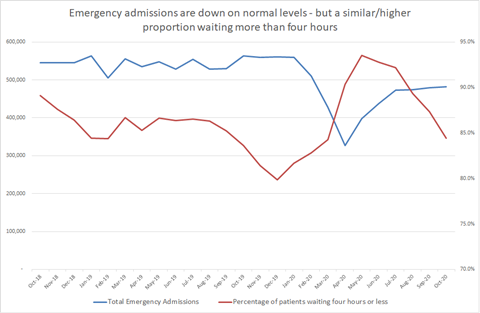
However some figures seen by HSJ — as well as the accounts of senior managers, doctors and nurses running hospitals — indicate high operational pressures through October and November as they have dealt with combined factors.
This is a combination of rapid growth in covid patient admissions, non-covid seasonal demands, staff absences linked to covid, and extensive measures they need to take to try to prevent covid spreading in hospital.
The latter measures - such as trying to get rapid tests for emergency patients, keeping them spaced, and separating them into positive, suspected and negative cohorts — mean, senior managers say, that to keep a hospital running relatively smoothly, occupancy levels need to be a lot lower than would normal be achievable (70-80 per cent rather than up to 95 per cent).
It means hospitals are now working where they can to keep occupancy at a lower level in general beds and critical care, both to contain covid spread and to be ready if they do face a surge in covid patients.
In recent weeks there have been widespread cancellations of planned care across the north of England and Midlands, and some in the south — meaning the NHS can’t meet the aim of being there for as many patients as normal.
Nationally, the number of patients experiencing 12-hour trolley waits — ie waiting to be admitted to a bed after they have been seen in A&E — was a huge 1,267 in October, up from 725 the previous year. Figures seen by HSJ suggest it is on course to be even larger in November. During winter 2019-20, 12-hour waits peaked at 2,847 in January 2020, while several months recorded more than 1,000 cases. Other figures on emergency care and bed pressures seen by HSJ suggest that they have increased rapidly since the summer — ending the lull since the spring — and are worse than most autumns, but not as severe as seen at times in recent winters.
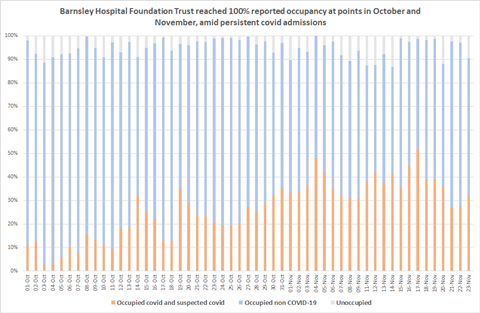
But several hospitals have run very short of capacity in recent weeks when covid admissions have risen quickly, and coincided with pressure from non-covid patients. This has happened in both overall hospital beds and critical care.
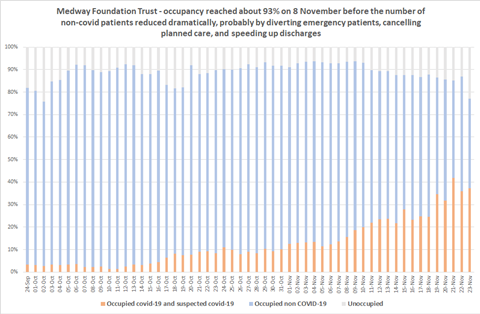
In early November, HSJ revealed Medway Foundation Trust in Kent saw severe problems including very long waits for patients being transferred from ambulances to hospitals, of up to five hours, of a kind which would not normally be seen until the most intense weeks of winter.
It was close, at the least, to being “overwhelmed”. Last week, again, there were severe pressures. Internal figures show its occupancy reached over 95 per cent earlier this month when rising covid numbers combined with non-covid (see chart at bottom of the article).
This week we report that United Lincolnshire Hospitals has seen its worst week ever. A similar picture was being seen at Barnsley Hospital Foundation Trust where unoccupied beds, as officially reported to NHS England, fell to virtually zero (chart right).
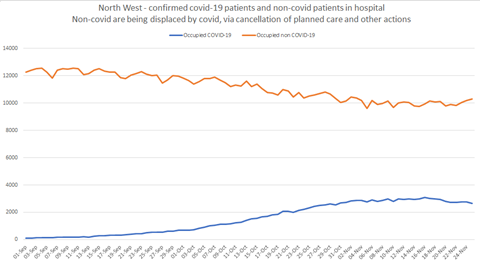
There is clear evidence of non-covid patients being displaced by covid - this is mostly because planned operations have been cancelled when critical care gets too full, and when other areas have to be repurposed to make way for covid patients, as well as some reductions in emergency care cases and efforts to speed up discharge (see line chart left/below of the North West).
Some of the hardest-hit hospitals have opened extra critical care beds to cope with covid, but this has been limited. That’s because the large majority of covid patients in the second wave are being cared for in less intensive beds, with oxygen support; and also because surging critical care capacity unnecessarily would lead to more routine services being cancelled and require more staff to be redeployed.
The government’s winter plan states starkly that the NHS in recent years has had to cancel a lot of elective care in January and February just to deal with normal winter demand — so this pressure release valve, as used to create more space over the past couple of months, will not be available.
Some would argue hospitals have routinely been “overwhelmed” in recent winters. With covid, there’s now more at stake than usual, with many eyes on whether the NHS is providing a robust “third line of defence” against the pandemic.
In areas where covid is suppressed, there’s a possible winter ahead where hospitals on the whole are quieter, have less operational problems, and perhaps provide better care than in other recent winters; since many enter with fewer patients in beds, and lower emergency attendances, thanks to lockdown rules and behaviour keeping other ailments and accidents down a little.
But autumn has shown covid hospital admissions - both from the community and spread on the wards - can still increase consistently, and quite quickly. If and where this is the case in the next few months, combining with winter demand, the virus will “overwhelm” many more hospitals.
Downloads
FINAL-quick-ref-health-systems-heatmap-PDF
PDF, Size 0.22 mb
Source
Data published by NHS England and obtained by HSJ
Source Date
November 2020




4 Readers' comments