- Growth in recent week suggests number of trusts with third of beds occupied by covid patients will more than double by 31 December
- Two of these trusts are not in “tier four” areas and third spans a “tier four” boundary
- Dozens of trusts not in “tier four” areas see admissions grow — including in Liverpool, Birmingham and Sheffield
There are 14 hospital trusts on course to have at least a third of their beds filled by covid patients on New Year’s Eve.
HSJ analysed current occupancy and growth at each general acute trust in the seven days to 21 December.
Projecting the same rate of growth forward, the number of trusts with at least a third of their bedbase likely to be taken by covid patients would increase from five at present to 14.
Three of the four acute trusts in Kent are projected to have covid bed occupancy of over 40 per cent.
Another two trusts are in areas covered by tier two restrictions. They are Queen Elizabeth in Norfolk, and Countess of Chester. A third, East Sussex, has one of its two general hospitals in “tier four” (St Leonards), and the other in Eastbourne, which is outside the Sussex “tier four” zone.
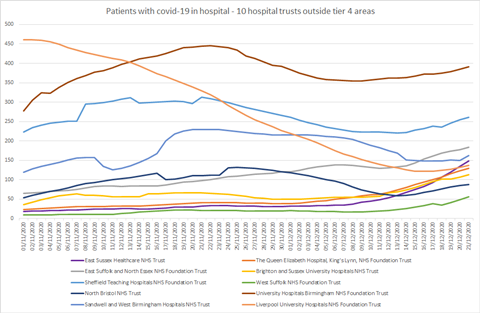
There are also 27 trusts not in tier four areas which had more than 50 covid patients on 21 December, and where the number of covid patients grew by at least 20 per cent in that week. These include Liverpool University Hospitals and Sheffield Teaching Hospitals.
HSJ last week projected that, if trends continued, English hospitals would have just short of 19,000 covid patients on New Year’s Eve in total — almost exactly the same as the 12 April first wave peak. Current projections put that number at over 20,000.
The 14 trusts projected to have more than a third of third beds filled by covid patients on 31 December are:
| Trust | Daily rise/fall in covid patients in seven days to 21 December | Covid occupancy % on 21 December | Projected covid occupancy % on 31 December |
|---|---|---|---|
| Maidstone and Tunbridge Wells NHS Trust | 8.0 | 34% | 45% |
| East Kent Hospitals University NHS Foundation Trust | 7.9 | 35% | 42% |
| The Queen Elizabeth Hospital, King’s Lynn, NHS Foundation Trust | 7.0 | 27% | 42% |
| Medway NHS Foundation Trust | -1.7 | 45% | 41% |
| North Tees and Hartlepool NHS Foundation Trust | 3.1 | 35% | 41% |
| Barking, Havering and Redbridge University Hospitals NHS Trust | 6.1 | 33% | 40% |
| Mid and South Essex NHS Foundation Trust | 19.6 | 26% | 37% |
| Portsmouth Hospitals University National Health Service Trust | 11.3 | 26% | 37% |
| East Sussex Healthcare NHS Trust | 11.6 | 21% | 37% |
| North Middlesex University Hospital NHS Trust | 6.1 | 23% | 36% |
| The Hillingdon Hospitals NHS Foundation Trust | 3.1 | 27% | 35% |
| Homerton University Hospital NHS Foundation Trust | 3.0 | 23% | 35% |
| Barts Health NHS Trust | 16.7 | 23% | 33% |
| Countess of Chester Hospital NHS Foundation Trust | 1.0 | 31% | 33% |
A director at one of the trusts indicated the reality on the ground was even more severe than the figures suggested, saying their trust had already cancelled most inpatient planned care. They added that “based on current rates of admission”, all the beds of the entire large trust would be “full with covid patients in early January”.
Liverpool University Hospitals saw the greatest pressure in the autumn. The situation at the trust was improving, with government trumpeting the success of behaviour change and lateral flow testing.
However, speaking yesterday to HSJ, a senior health source in the city said covid hospital cases had “barely [gone] down before [they] started rising again”. He said the infection rate in the city among over 80s had doubled in a week, and it was now preparing to see fast growth: “The rise in London [and the South East] was incredibly rapid, [we are] expecting to see similar elsewhere.”
According to reports this morning, the government is due to announce more areas moving into “tier four” today, possibly to come into force on Boxing Day. “Tier four” includes no Christmas relaxation of mixing rules.
This chart shows the trend at 10 trusts which are not in “tier four” but are seeing growth in the number of covid patients in hospital:

*All figures and the chart use a seven-day rolling average. The calculations are based on trusts’ daily reported data, which is used in daily reporting by government, but is not validated. Occupancy shares are based on trusts’ total open general and acute beds in mid December, in NHSE published data.
Source
Data reported by trusts, shared with HSJ
Source Date
December 2020


7 Readers' comments